# 2.2.3 函数与图形
## 基本函数表达
#### root中的函数表达和C语言重合,例如:
* `sin(x)/x`
* `[0]*sin(x) + [1]*exp(-[2]*x)`
* `x + y**2`
* `x^2 + y^2`
* `[0]*pow([1],4)`
* `2*pi*sqrt(x/y)`
* `gaus(0)*expo(3) + ypol3(5)*x`
* `gausn(0)*expo(3) + ypol3(5)*x`
* `gaus(x, [0..2]) + expo(y, [3..4])`
在以上最后一个示例中:
* `gaus(0)` 是 `[0]*exp(-0.5*((x-[1])/[2])**2)` 的简写形式,`(0)` 表示从 0 开始编号参数。
* `gausn(0)` 是 `[0]*exp(-0.5*((x-[1])/[2])**2)/(sqrt(2*pi)*[2]))` 的简写形式,`(0)` 表示从 0 开始编号参数。
* `expo(3)` 是 `exp([3]+[4]*x)` 的简写形式。
* `pol3(5)` 是 `par[5]+par[6]*x+par[7]*x**2+par[8]*x**3` 的简写形式(`PolN` 表示 N 次多项式)。
* `gaus(x, [0..2])` 是 `gaus(0)` 的一种更明确的写法。
* `expo(y, [3..4])` 是 `exp([3]+[4]*y)` 的简写形式。
[`TMath`](https://root.cern/doc/master/namespaceTMath.html) 作为表达式的一部分:
* `TMath::Landau(x)*sin(x)`
* `TMath::Erf(x)`
公式可以包含常量,例如:
* `sqrt2`
* `e`
* `pi`
* `ln10`
* `infinity`
e.g. 两个简单的例子
```c
{
auto fa1 = new TF1("fa1","sin(x)/x",0,10);
fa1->Draw();
}
```
 ```c
{
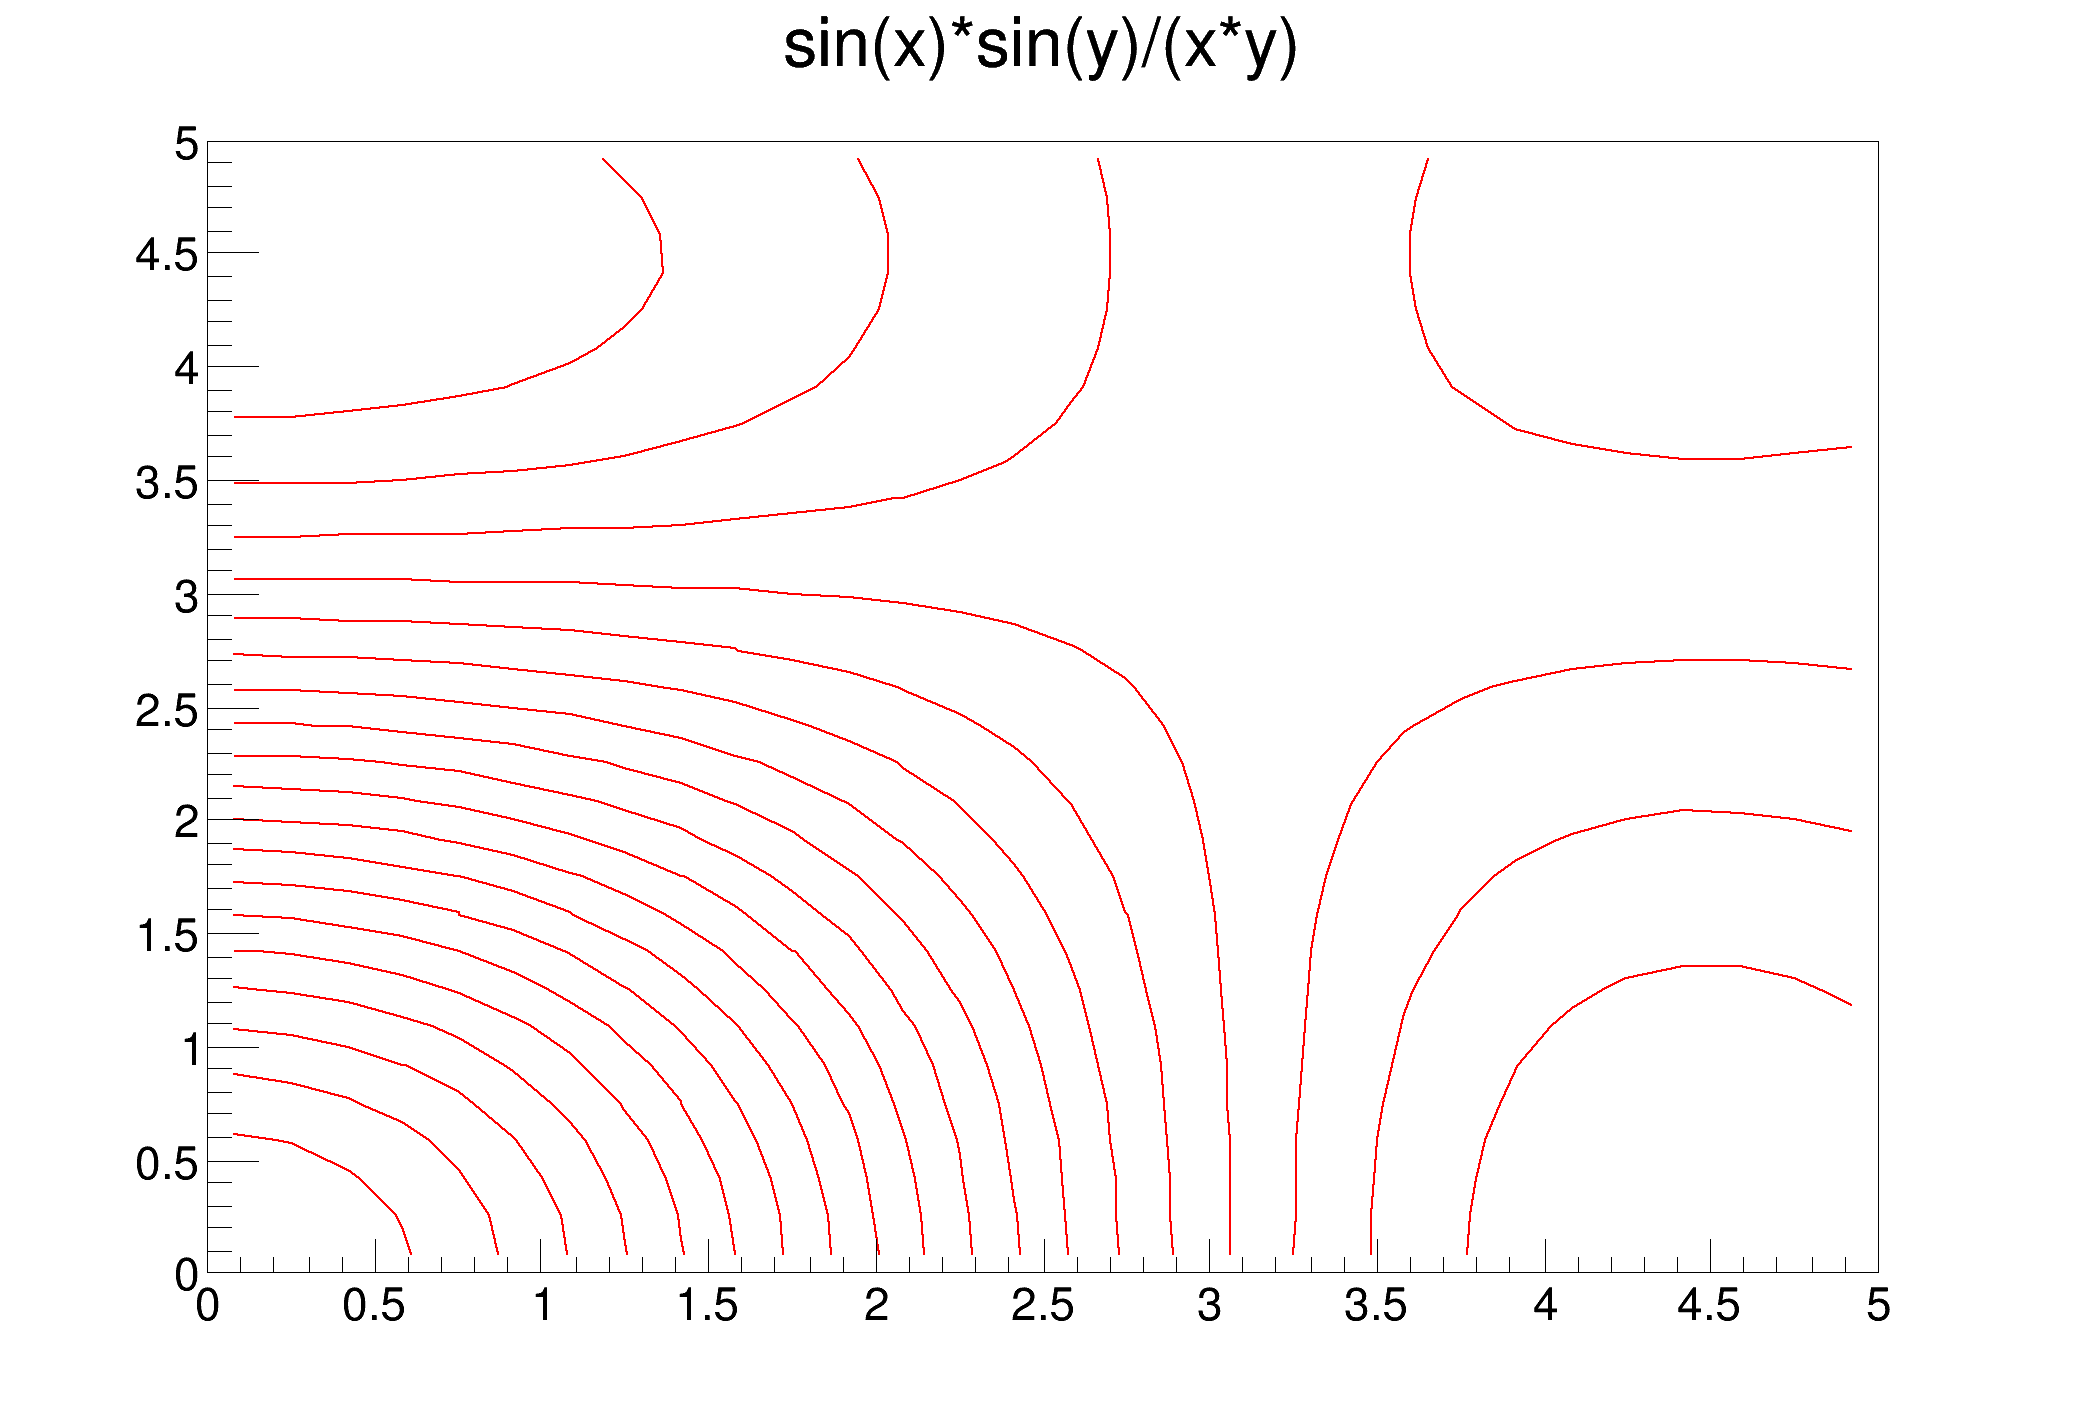
auto f2 = new TF2("f2","sin(x)*sin(y)/(x*y)",0,5,0,5);
f2->Draw();
}
```
```c
{
auto f2 = new TF2("f2","sin(x)*sin(y)/(x*y)",0,5,0,5);
f2->Draw();
}
```
 ## 直线 TLine
```
root[] l = new TLine(0.2,0.2,0.8,0.3)
root[] l->Draw()
```
## 直线 TLine
```
root[] l = new TLine(0.2,0.2,0.8,0.3)
root[] l->Draw()
```
仿造 python 的致密网格
```c
void DrawGrid(TString t, Int_t ngx, Int_t ngy)
{
Double_t x1 = -10;
Double_t x2 = 20;
Double_t y1 = 10;
Double_t y2 = 40;
Double_t xs = (x2-x1)/ngx;
Double_t ys = (y2-y1)/ngy;
Int_t i;
TH1F *h = gPad->DrawFrame(x1, y1, x2, y2);
h->GetXaxis()->SetNdivisions(20);
h->GetYaxis()->SetNdivisions(20);
h->GetYaxis()->SetTickLength(0.);
h->GetXaxis()->SetTickLength(0.);
h->GetXaxis()->SetLabelSize(0.025);
h->GetYaxis()->SetLabelSize(0.025);
h->SetTitle(t.Data());
gPad-> Update();
TLine l;
l.SetLineColor(kGray);
Double_t x = x1+xs;
for (i = 0; iSetTitle("Before");
before->SetMarkerStyle(kFullCircle);
before->SetMarkerColor(kBlue);
DrawGrid("Before/After plot", 100, 100);
before->Draw("P");
// Double_t a[10] = {-1.,2.,-3.,4.,-5.,1.,2.,-6.,7.,-8.};
// Double_t b[10] = {25.,24.,22.,31.,32.,27.,23.,35.,38.,22.};
Double_t a[10] = {-1.,2.,-3.,4.,-5.,1.,2.,-6.,7.,-8.};
Double_t b[10] = {25.,24.,22.,31.,32.,27.,23.,35.,38.,22.};
TGraph *after = new TGraph(10, a, b);
after->SetMarkerStyle(kFullCircle);
after->SetMarkerColor(kRed);
after->Draw("P");
}
```
## 箭头 TArrow
```c
TArrow *ar = new TArrow(4,0.2,4,4.5,0.02,"|>");ar->SetLineWidth(3); ar->SetArrowSize(0.02);ar->Draw();
```
箭头方向可以控制。e.g. `ar4->[SetAngle](60);`。
**参考:**[classTArrow](https://root.cern/doc/master/classTArrow.html)
## 矩形 TBox
```c
b = new TBox(0.2,0.2,0.8,0.3); b->SetFillColor(5); b->SetFillStyle(3001); b->Draw();
```
## 矩形文本框 TPaveLabel
```c
TPaveText *pave = new TPaveText(-3.78,500,-1.2,750);
TText *t1=pave->AddText("You can move");
t1->SetTextColor(4);
t1->SetTextSize(0.05);
pave->AddText("Title and Stats pads");
pave->AddText("X and Y axis");
pave->AddText("You can modify bin contents");
pave->Draw();
c1->Update();
```
## 椭圆 TEllipse
TEllipse是很强大的类,它能帮你绘制椭圆、圆、半圆、倾斜的椭圆等,其标准用如下:
```c
TEllipse *ellipse; // 设置PSF于Pad
ellipse = new TEllipse(Ra[i]+w2*3/5.,Dec[i]-w*3/5.,R[i]*1.51/cos(Dec[i]/57.3),R[i]*1.51,0,270,60); // TEllipse(椭圆在Pad中的横坐标,纵坐标,长轴,短轴,phimax,phimin,theta)
ellipse->SetFillStyle(0); // 设置PSF的填充风格为0,意为不填充,默认不填充
ellipse->SetLineWidth(2); // 设置PSF线宽为2
ellipse->SetLineColor(3); // 设置PSF的轮廓色为3,绿色
ellipse->Draw(); // 将PSF添加至画布
```
## 蜂巢图
e.g.
```c
void th2polyHoneycomb(){
TCanvas *C = new TCanvas("C", "C", 1200, 600);
C->Divide(2,1);
TH2Poly *hc1 = new TH2Poly();
hc1->Honeycomb(0, 0, .1, 5, 5);
hc1->SetTitle("Option V (default)");
hc1->SetStats(0);
hc1->Fill(.1, .1, 15.);
hc1->Fill(.4, .4, 10.);
hc1->Fill(.5, .5, 20.);
TH2Poly *hc2 = new TH2Poly();
hc2->Honeycomb(0, 0, .1, 5, 5, "h");
hc2->SetTitle("Option H");
hc2->SetStats(0);
hc2->Fill(.1, .1, 15.);
hc2->Fill(.4, .4, 10.);
hc2->Fill(.5, .5, 20.);
C->cd(1)->SetGrid();
hc1->Draw("colz L");
C->cd(2)->SetGrid();
hc2->Draw("colz L");
}
```
## 多边形
polygon
```c
{
Double_t x[5] = {.2,.6,.7,.25,.2};
Double_t y[5] = {.5,.1,.9,.7,.5};
TPolyLine *pline = new TPolyLine(5,x,y);
pline->SetFillColor(38);
pline->SetLineColor(2);
pline->SetLineWidth(4);
pline->Draw("f");
pline->Draw();
}
```
e.g.
```c
void inside() {
auto el = new TEllipse(0.75, 0.25, .2,.15,45,315,62);
el->Draw();
auto gr = new TGraph();
double gr_x1[5] = {0.1, 0.3388252, 0.03796561, 0.4176218, 0.1};
double gr_y1[5] = {0.5, 0.9644737, 0.7776316, 0.6960526, 0.5};
gr = new TGraph(5, gr_x1, gr_y1);
gr->Draw("L");
auto bx = new TBox(.7, .8, .9, .95);
bx->Draw();
auto pv = new TPave(.05, .1, .3, .2);
pv->Draw();
auto di = new TDiamond(.05, .25, .3, .4);
di->Draw();
auto cr = new TCrown(.5, .5, .1, .15);
cr->SetFillColor(19);
cr->Draw();
for (int i = 0; i < 10000; i++) {
double x = gRandom->Rndm();
double y = gRandom->Rndm();
auto p = new TMarker(x,y,7);
p->Draw();
if (el->IsInside(x,y) || bx->IsInside(x,y) || pv->IsInside(x,y) || di->IsInside(x,y) || cr->IsInside(x,y) ||
gr->IsInside(x,y)) {
p->SetMarkerColor(kGreen);
} else {
p->SetMarkerColor(kRed);
}
}
}
```
## 地图
USAmap
```csharp
void th2polyUSA()
{
Int_t i, bin;
const Int_t nx = 48;
const char *states [nx] = {
"alabama", "arizona", "arkansas", "california",
"colorado", "connecticut", "delaware", "florida",
"georgia", "idaho", "illinois", "indiana",
"iowa", "kansas", "kentucky", "louisiana",
"maine", "maryland", "massachusetts", "michigan",
"minnesota", "mississippi", "missouri", "montana",
"nebraska", "nevada", "new_hampshire", "new_jersey",
"new_mexico", "new_york", "north_carolina", "north_dakota",
"ohio", "oklahoma", "oregon", "pennsylvania",
"rhode_island", "south_carolina", "south_dakota", "tennessee",
"texas", "utah", "vermont", "virginia",
"washington", "west_virginia", "wisconsin", "wyoming"
};
Double_t pop[nx] = {
4708708, 6595778, 2889450, 36961664, 5024748, 3518288, 885122, 18537969,
9829211, 1545801, 12910409, 6423113, 3007856, 2818747, 4314113, 4492076,
1318301, 5699478, 6593587, 9969727, 5266214, 2951996, 5987580, 974989,
1796619, 2643085, 1324575, 8707739, 2009671, 19541453, 9380884, 646844,
11542645, 3687050, 3825657, 12604767, 1053209, 4561242, 812383, 6296254,
24782302, 2784572, 621760, 7882590, 6664195, 1819777, 5654774, 544270
};
TCanvas *usa = new TCanvas("USA", "USA");
usa->ToggleEventStatus();
Double_t lon1 = -130;
Double_t lon2 = -65;
Double_t lat1 = 24;
Double_t lat2 = 50;
TH2Poly *p = new TH2Poly("USA","USA Population",lon1,lon2,lat1,lat2);
TFile::SetCacheFileDir(".");
TFile *f = TFile::Open("http://root.cern.ch/files/usa.root", "CACHEREAD");
if (!f) {
printf("Cannot access usa.root. Is internet working ?\n");
return;
}
// Define the TH2Poly bins.
TMultiGraph *mg;
TKey *key;
TIter nextkey(gDirectory->GetListOfKeys());
while ((key = (TKey*)nextkey())) {
TObject *obj = key->ReadObj();
if (obj->InheritsFrom("TMultiGraph")) {
mg = (TMultiGraph*)obj;
bin = p->AddBin(mg);
}
}
// Fill TH2Poly.
for (i=0; iFill(states[i], pop[i]);
gStyle->SetOptStat(11);
p->Draw("colz textn");
}
```
* 等高线绘法:
* 经纬度绘法:
## 费曼图
e.g.
```c
void feynman()
{
TCanvas *c1 = new TCanvas("c1", "A canvas", 10, 10, 600, 300);
c1->Range(0, 0, 140, 60);
Int_t linsav = gStyle->GetLineWidth();
gStyle->SetLineWidth(3);
TLatex t;
t.SetTextAlign(22);
t.SetTextSize(0.1);
TLine *l;
l = new TLine(10, 10, 30, 30);
l->Draw();
l = new TLine(10, 50, 30, 30);
l->Draw();
TCurlyArc *ginit = new TCurlyArc(30, 30, 12.5 * sqrt(2), 135, 225);
ginit->SetWavy();
ginit->Draw();
t.DrawLatex(7, 6, "e^{-}");
t.DrawLatex(7, 55, "e^{+}");
t.DrawLatex(7, 30, "#gamma");
TCurlyLine *Gamma = new TCurlyLine(30, 30, 55, 30);
Gamma->SetWavy();
Gamma->Draw();
t.DrawLatex(42.5, 37.7, "#gamma");
TArc *a = new TArc(70, 30, 15);
a->Draw();
t.DrawLatex(55, 45, "#bar{q}");
t.DrawLatex(85, 15, "q");
TCurlyLine *gluon = new TCurlyLine(70, 45, 70, 15);
gluon->Draw();
t.DrawLatex(77.5, 30, "g");
TCurlyLine *z0 = new TCurlyLine(85, 30, 110, 30);
z0->SetWavy();
z0->Draw();
t.DrawLatex(100, 37.5, "Z^{0}");
l = new TLine(110, 30, 130, 10);
l->Draw();
l = new TLine(110, 30, 130, 50);
l->Draw();
TCurlyArc *gluon1 = new TCurlyArc(110, 30, 12.5 * sqrt(2), 315, 45);
gluon1->Draw();
t.DrawLatex(135, 6, "#bar{q}");
t.DrawLatex(135, 55, "q");
t.DrawLatex(135, 30, "g");
c1->Update();
gStyle->SetLineWidth(linsav);
}
```